- Cipher Digest
- Posts
- Technical Breakdowns, Trading Tips, Market Overview + more | Cipher Digest
Technical Breakdowns, Trading Tips, Market Overview + more | Cipher Digest
Want to know where the market is going next? This article will help you do just that.
Asim Sar
July 04, 2023
Happy 4th of July! 🇺🇸
Now, for all those outside of the US, we still have some work to do. There’s ALOT of very spicy alpha in today’s piece, so let’s jump in!
In Todays Digest:
Latest In Web3 🚨
Tuesday Technicals 📈
Tuesdays Trading Ideas 💸
Trends and Trading Ranges 101
Crypto Market Analysis 📊
TradFi Update 📰
Tweet of the Day🐦
Latest In Web3 🚨
BlackRock Bitcoin ETF application refiled
Gemini’s Winklevoss demands $1.47 billion payment from DCG in ‘final offer’
Crypto ATM operator Bitcoin depot debuts on Nasdaq
Singapore requires crypto companies to hold customer funds in a trust
Thai SEC introduces new rules for digital asset providers
Tuesday Technicals 📈
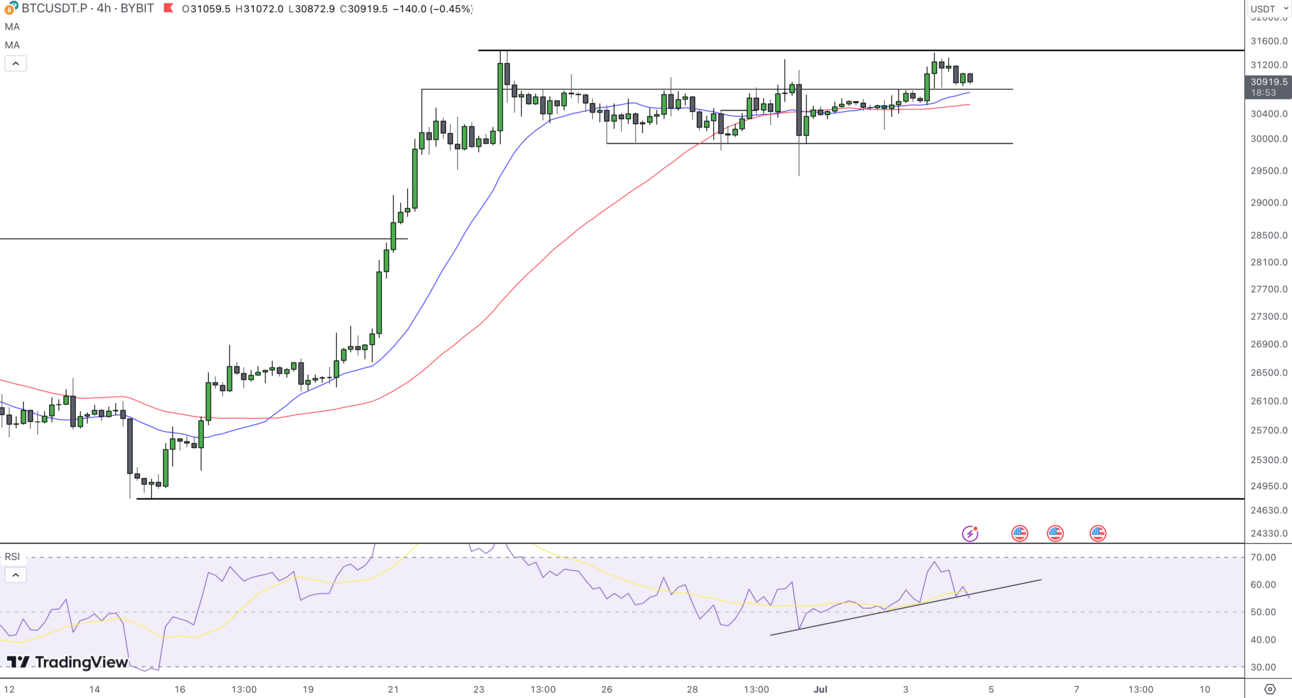
BTC has been holding its range since the 23rd of June, bouncing largely between $31,000 and $31,500.
As shown in the chart above, the price has recently failed to break through the upper resistance and make a new high, this marks the 3rd time that the price has failed to break up, showing the bulls just don’t have the strength and the market doesn’t have the liquidity.
The RSI is also threatening a break of the support which has helped us stay in the upper half of the range since the start of July.
The key level to now watch in the short term is the kinda mid-range support we are holding now (which lines up with the 20 & 50 MAs), at $30,800.
I think that if we see a price breakdown from here, we see a move at least as low as $29,500.
Remember if you're looking for more trading tips, trade setups and more, dont forget to join our discord!
Tuesdays Trading Ideas 💸
The risk to reward for shorting right now does seem pretty favourable, BUT I will be waiting to see the price try and fake out the market by bursting above the resistance and crashing back down after causing some liquidations.
Recent market conditions have been rough with the market giving alot of trouble to traders, with some pretty GNARLY price action… just open up your charts and take a look at some of the wicks…
We will be looking at getting some trades in this week, most likely tomorrow since today we don’t expect much volatility or movement that is worth trading. (since US markets are shut today)
BUT SINCE CIPHER LOVES YOU…
We will be bringing you some TOP TIER TRADING ALPHA.

Trends and Trading Ranges 101
What is a Trend?
A TREND exists when prices continuously rise and fall over a period of time, in a general direction.
In an ideal uptrend, each rally makes a higher high, going past the previous high formed. Each downside move holds support and remains higher than the previous low.
In a downtrend, each down move (pullback) makes a lower low and each rally tops out lower than the previous rally.

What is a Range?
In a TRADING RANGE, the majority of rallies top out in the same price area and each decline holds support at a similar price area.
We use the term price area because price action is never exact and we have to consider the small variances.

Markets are imperfect, and perfect patterns are very rare in financial markets. These small deviations can make it much more difficult for technical analysts.
Trends and trading ranges call for different tactics.
When you go long in an uptrend or sell short in a downtrend, you have to give that trend the benefit of the doubt and use a stop loss which gives you some breathing space, so you are not liquidated in a quick market wick.
In a trading range, on the other hand, you have to use slightly more tight stop losses and close out positions as soon as you see a sign of a breakout. Another difference in trading tactics between trends and ranges is the handling of strengths and weaknesses.
You have to follow strength during trends:
Buy in uptrends;
Short in downtrends.
When prices are in a trading range, you aim to do the opposite:
Buy weakness:
Sell strength.
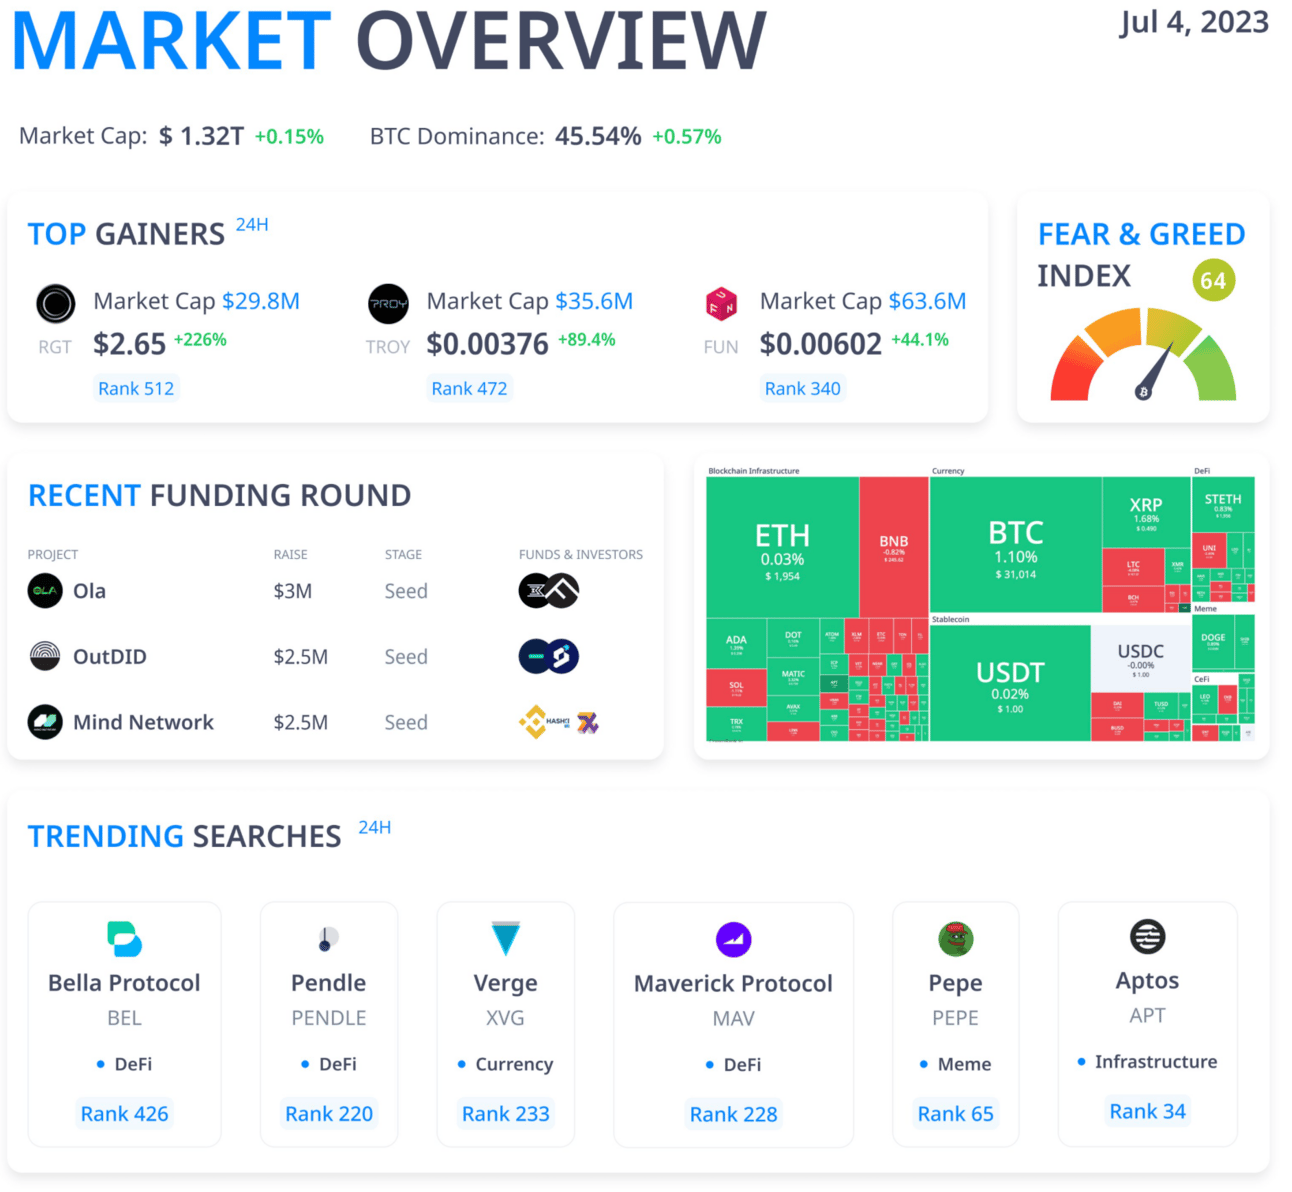
Crypto Market Analysis 📊
Even though the crypto markets rallied in June, there's been a significant fall in spot trade volumes in the last quarter of the year, with levels plunging to their lowest since 2020.
Binance suffered the most severe reduction in trade activity, seeing nearly 70% evaporation of volumes. This came after the news that they were being sued by the SEC and also introducing fees on certain pairs again.
It wasn’t just Binance that suffered though, more than 50% falls were also seen in the trade volumes on other major exchanges, such as Coinbase, Kraken, OKX, and Huobi, during the same period.

Now let’s take a look into how each sector has been performing…
Layer 2 (L2) tokens, which were the best performers in Q1, realllyyyy slowed down in Q2. The decline was quite comprehensive, with the pretty much all L2 projects showing drops ranging from 20% to 40%.
Layer 1 tokens were not immune to this market downturn either, falling by 24% in Q2.
So even though we felt like the markets have been good recently, alts have still been suffering.
DeFi tokens ended Q2 with a modest 8% decline, however, they showed some promising signs of recovery in June, made up mostly by the gains from MakerDAO (MKR) and Compound (COMP) tokens.
COMP, in particular, has seen a remarkable surge of over 50% in the last week, fueled by an uptick in high-value purchases on Binance.
The Top 2 Cryptos, (BTC and ETH), stood out to me since they actually maintained positive growth for both Q’s this year!
Their ability to stay strong in a changing and strict regulatory environment shows how stable they are, independent of external factors.

TradFi Update 📰
If you're wondering why markets are kinda boring today it’s because the U.S. markets are closed to celebrate the 4th of July.
BUT… that doesn’t mean there is nothing to look into.
Looking at past/historical data can very often reveal a certain pattern in the performance of the stock market. - This is a what we call Technical Analysis (TA).
Quite often, if the first half of the year has a strong performance, it tends to set the stage for continued gains in the 2nd half. However, it's important to note that while historical trends can provide insights, they do not guarantee future results.

Tweet of the Day🐦
markets have changed meaningfully over the years & some of the dynamics have evolved but the #btc#btcinance chart remains incredibly useful to the few who can interpret it correctly.
what we have right now is a serious CHANGE OF BEHAVIOR.
exciting times ahead so stick around! http
— few (@fewseethis)
8:24 PM • Apr 28, 2023