- Cipher Digest
- Posts
- Tuesday Technicals 💸, Profitable Trade Idea📈, & Market Updates | Cipher Digest
Tuesday Technicals 💸, Profitable Trade Idea📈, & Market Updates | Cipher Digest
Tuesday Technicals 💸, Profitable Trade Idea📈, & Market Updates | Cipher Digest
Asim Sar
June 13, 2023
Yo-yo, markets have been stable and kinda boring but we still have updates for you guys. In Today Digest:
Tuesday Technicals (BTC & ETH) 📈
Crypto Market Analysis 🧐
Trade Ideas for the week 💸
TradFi Analysis 📊
Tweets of the Day 🐦

The US has come after crypto… since then we have been through at a lot:
Hong Kong has legalised retail trading
Europe has introduced a new MiCA framework
UAE and UK are both pushing "Crypto Hub" narratives
A16z opens a new London office
Coinbase + Gemini have launched international platforms
Russia's Sberbank is offering crypto trading
The great migration is upon us..
Tuesday Technicals & Trades
When the market gets a little wobbly, it's often a smart move to focus on the big players, no matter what asset class we're talking about.
And guess what?
In the crazy world of crypto, both Bitcoin and Ethereum have been flexing their muscles and taking centre stage.
But what does that mean exactly? Well, let me break it down for you.
When we talk about dominance in the crypto realm, we're referring to the market share or the predominance of a particular crypto. In simpler terms, it's like saying Bitcoin and Ethereum are the cool kids on the block right now, grabbing the attention and calling the shots. As BTC or ETH dominance rises or falls, we can gauge whether market participants are interested in a crypto or not.

EG: If BTC dominance is rising, then we know that:
Investors are moving from alts into BTC
Investors are looking for a less risky investment, market sentiment is poorer.
Now, let's dive into some specifics. ETHUSDT, that's Ethereum for you, has been a bit on the quiet side since Saturday's drop. It's been trading within a tight range, bouncing back and forth between 1780 and 1715.
As shown on the charts below, ETH dominance has fallen while BTC has rose. This can be taken as a sign that the market is looking at BTC as the safest place to invest right now and ETH has some uncertainty in the air.


But here's a little trade idea for you brave souls:
Last weeks trade idea, played out PERFECTLY for all the members. We are now hovering at the prev month lows, which is now key support.
Keep an eye out for a range breakout. If it breaks above 1780, we might see prices shoot up towards 1855. On the flip side, if it breaks below 1715, brace yourselves for a potential drop towards 1690, and who knows, maybe even 1635.

Crypto Market Update
BTC’s non-liquid supply has skyrocketed to an all-time high of 15.17 million. Yep, you heard it right, people are HODLing their precious BTC like never before!
But what exactly is this non-liquid supply?
Well, it's the amount of BTC that folks are keeping to themselves, tucked away and not easily available for trading or selling.
Now, here's the kicker: a whopping 72% of the total circulating supply falls into this illiquid category. That's a whole lot of BTC not being thrown around in the trading frenzy. And what's even more interesting is that this percentage is dancing like nobody's business, changing faster than a chameleon at a disco. (does that make sense)
To put things into perspective, the last time we witnessed such a lightning-fast shift in liquidity was during the LUNA market downturn and the FTX market failure. So, we're talking about some serious movement here, folks.
In the past 30 days alone, a staggering 131,000 Bitcoin have made their way into the "illiquid" club. It's the fastest transition rate we've seen in the wild year of 2023.
So, whether you're a Bitcoin HODLer or a crypto-trader, keep your eyes peeled.

Traditional Finance Update
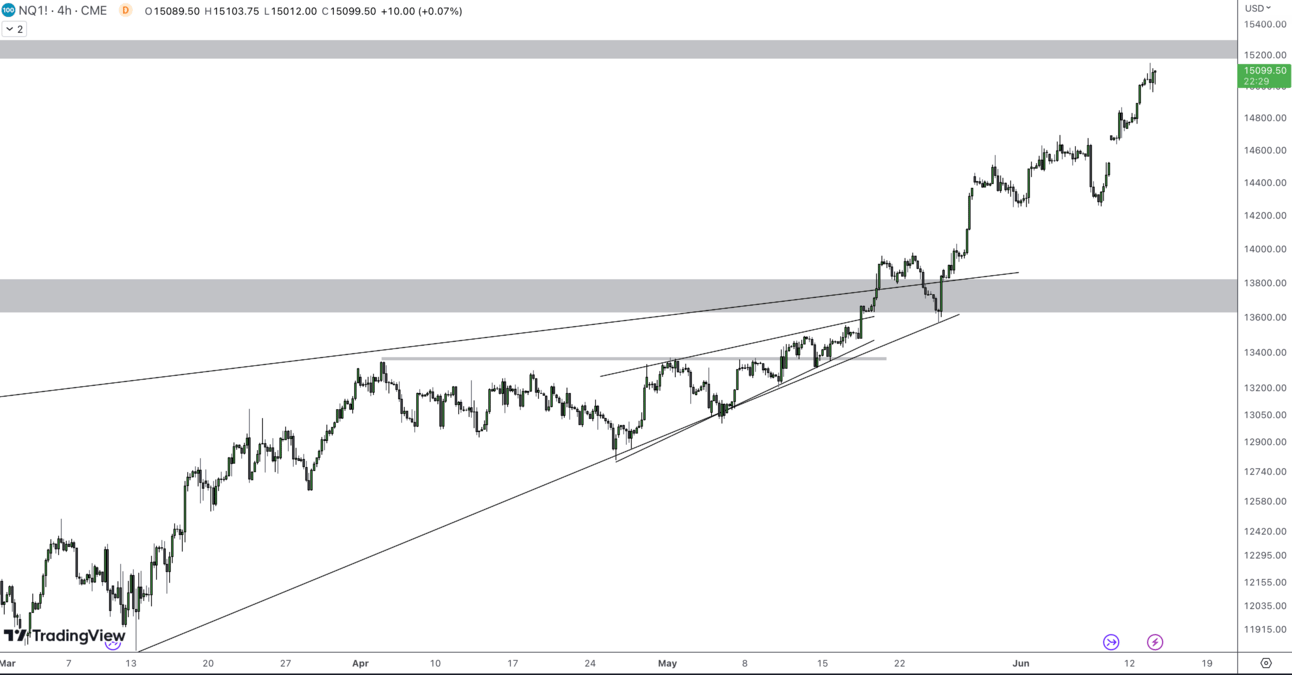
It's a brand new day in the world of TradFi, and guess what? We're seeing some teeny-tiny gains happening this Tuesday. Nasdaq (NQ) is strutting its stuff with a 0.60% increase, while the S&P 500 (ES) is doing its own little happy dance with a 0.30% bump.
But hold on, there's more to this story. Inflation has been making waves, and in May, it decided to take a chill pill. It rose by 4%, which is actually slightly better than the estimated 4.1%. We're talking about the lowest rate we've seen in the past two years!
Thank GOODNESS
Now, let's break it down even further.
When we remove those wild and crazy elements like food and energy prices from the equation, we get what's known as core inflation.
And guess what?
It rose by 0.4% within the month. That's like adding a sprinkle of extra spice to the mix. And when we compare it to the same period last year, it's still hanging high with a 5.3% increase.
So, what does all this mean?
Well, it means that even though the pressure on prices seems to be easing up a bit, US consumers are still wrestling with those ongoing economic challenges.
Tweet of the Day 🐦
The effects of Operation Chokepoint 2.0:
- DEX volumes relative to CEX are at an all-time high
- Tether at ATH & USDC down 50%
- Offshore volumes near ATH at 86%In the end, capital & activity will just move off-shore & on-chain; ultimately giving the US govt less oversight.
— Will Clemente (@WClementeIII)
5:23 PM • Jun 11, 2023